
Is there enough straw to build with? Sustainable Materials series

Originally posted 30th March 2022
It’s been a while since I updated my calculation of how much straw was available in the UK to build with. A little while of delving into UK government statistics later, and here are the updated results. I’ve looked at data for crop yields, straw yields, and end uses. Previously I’ve just looked at the latest years’ figures but this time I’ve averaged the last 10 years to get what I hope is a more reliable figure.
Somewhat frustratingly, government statistics for total crop yields is available right up to the end of 2020, but data on end use and percentage straw yield is only available up to 2018 or 2019, depending on which subset of data you’re looking at. To make the best estimate I could, I’ve taken the average end-use and straw production percentages from the most recent 10 years available and applied them to the total yield data from 2010 to 2020.
That’s resulted in the charts below, starting with the average annual production and hectares grown, of UK wheat, barley, and oats.
Figure 1: UK main cereal crop average annual production 2010:2020, thousands of tonnes
Figure 2: UK main cereal crop average annual area grown 2010:2020, thousands of hectares.
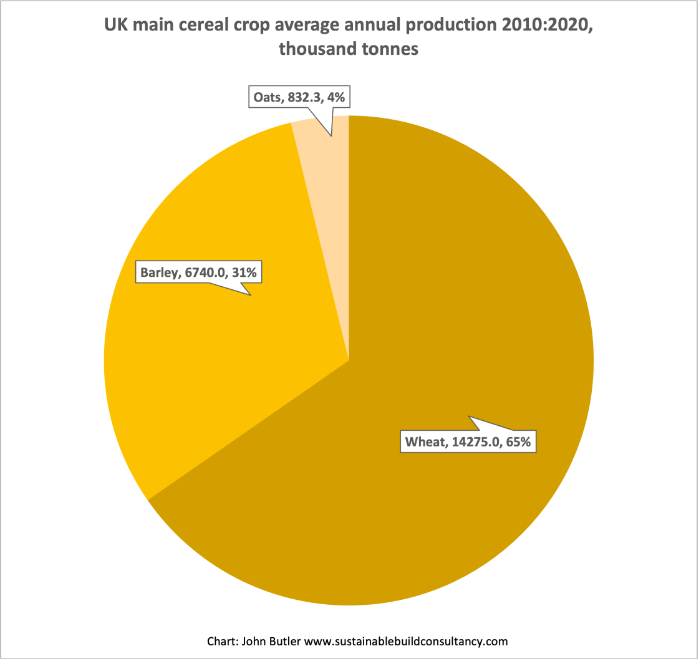
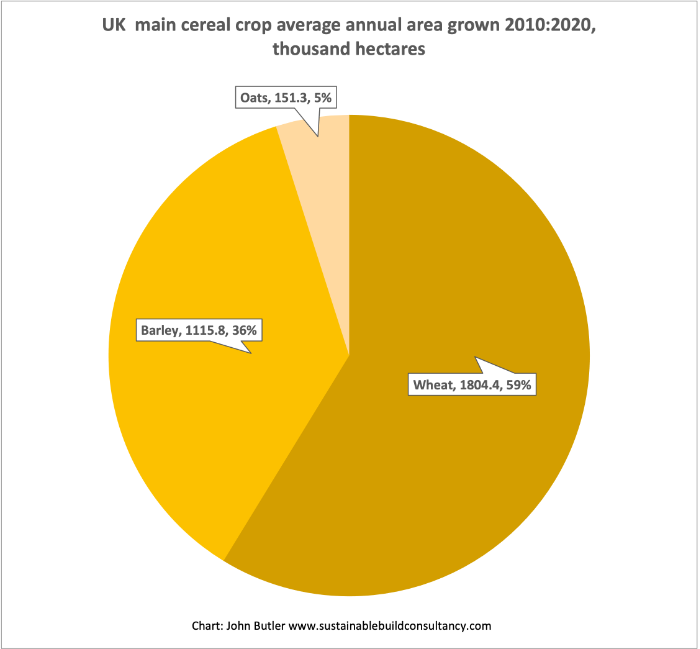
The yield per hectare is highest for wheat and lowest for oats, hence the discrepancy in proportions between tonnes produced and hectares grown. The average percentages of straw produced vary slightly too (as a proportion of each crop’s yield): wheat 53.6%, barley 50.7% and oats 60.6%. From a grain-production perspective the increased total yield/hectare and lower proportion of straw make wheat the most efficient crop to grow. That’s perhaps less good for those of us wanting to build with straw, as we might want as much straw as possible. There is an issue with straw lengths becoming shorter - for some construction purposes longer straws are helpful, though not essential. On the plus side, wheat straw has been shown to be a durable and effective material for building, so it’s good that there is plenty produced.
So how much straw is there?
Figure 3 shows the average annual straw production from oats, wheat and barley, in thousands of tonnes.
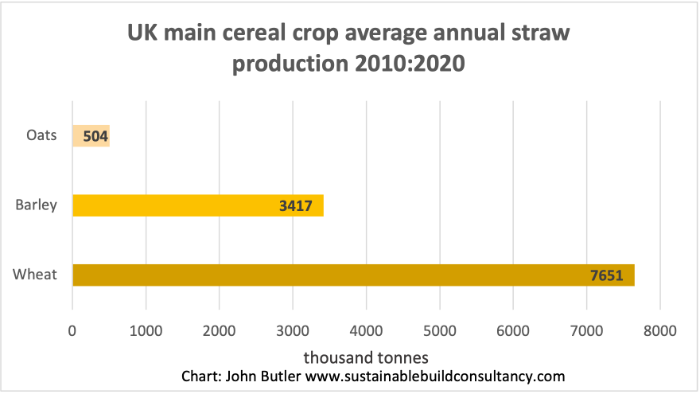
7651,000 tonnes of wheat straw, annually. That ought to build a fair few houses. Except most of that straw is already used somewhere, so is there really any available (spoiler: yes there is)?
Figure 4 shows the proportion of straw used for various purposes. “Home” means farm of origin.
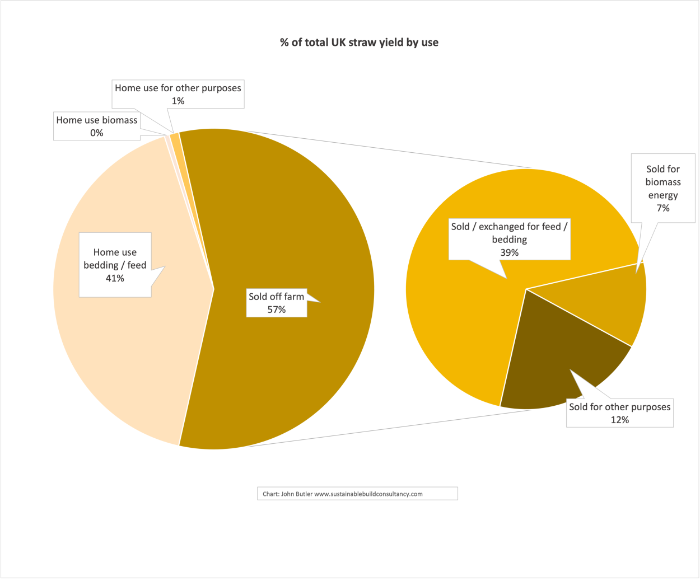
We’re looking at the 57% sold off farm - the part not used or needed by the farm of origin. The fact that this is all currently sold and used somehow suggests it’s less than accurate to call straw a waste product; co-product would be more accurate. As an aside, the proportion of the environmental impact of grain and straw production that’s assigned to each in life-cycle aassessment (LCA) depends on the economic value of each (I hope to write more about this soon with some new data on straw LCA).
Of the straw used on the home farm 41% goes to bedding, 0.49% is burned for energy production, and 1% is used for other purposes. It’s not clear from the data whether straw that is ploughed back in to the fields comes from that 1% or whether only straw that has been removed from the fields has been counted. I suspect the latter, but for now I am filing it to research later…
Currently, of the straw sold off farm, 39% is used for bedding (we’re talking animal bedding here…), 7% is burned to produce energy, and 12% is used for ‘other purposes’. Presumably straw for buildings comes from that last 12% at the moment. Arguably the percentage sold for energy production is least likely to fall (existing biomass power stations need to keep producing energy to justify their existence), but there is perhaps more wriggle room within the proportions sold for bedding or other purposes.
If we imagine a spectacular increase in the amount of straw bale building in the UK and assume a modest 5% of total straw production is used for construction, and shave 2.5% each off straw for bedding and other purposes (away from the farm of origin), the previous pie chart ends up looking like figure 5, below. Figure 6 shows the actual amounts in thousands of tonnes, applied to wheat straw only.
Figure 5: % of total UK straw yield by use, assuming 5% for construction.
Figure 6: UK wheat straw average production 2010:2020 by end use,
assuming 5% for construction, thousand tonnes
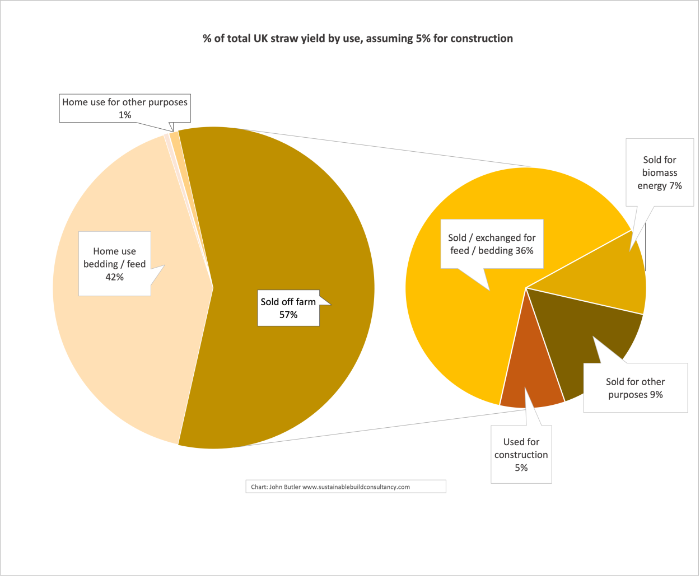
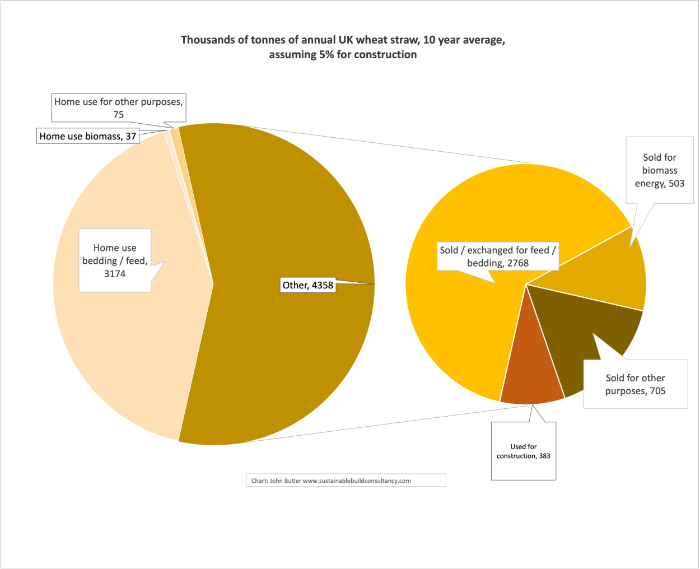
All of which is a long winded way of saying there could be around 383 thousand tonnes of straw available for construction every year, from just wheat straw (the most available and most frequently used straw for construction).
So how many houses is that? A three bed semi detached house of around 86m² floor area uses 350 small bales of around 20.5kg each (from Barbara Jones: Building with straw bales: a practical guide for the UK and Ireland, 2015). That makes 7.18 tonnes of straw per house. Divide 383 thousand tonnes (the 5% of available wheat straw) by 7.18 and you get 53.32.
So on average there’s enough straw available currently to build 53 thousand three bed semi-detached houses every year - just using 5% of annual wheat straw production. Differently sized houses would use different amounts of straw, but the general gist is there should be plenty - provided supply chains are established.
I’m hoping to write a blog about the environmental and carbon impact of building with straw soon, with some brilliant new data from Up Straw. In the meantime, I’ve written about the thermal performance of straw here: https://www.sustainablebuildconsultancy.com/blog/how-insulating-is-strawbale
EDIT, 31.3.21
having tracked down the UK gov data on proportion of straw removed from fields, I think the %s above apply to that portion only. On average (2014-2018) 73% of wheat straw is removed the field, 91.5% of barley. Which means my end numbers are a bit higher than they would be. Quick calc: 7651000 tonnes straw * 73% = 55855100 tonnes of straw removed from field 5% of that is 2792800 tonnes, divide that by 7.18 tonnes per 3-bed semi and you get 38923 houses per year. That’s less than I originally calculated, but still an awful lot of houses, and a multitude of times more than are currently built using straw.
Also worth highlighting more clearly that there can be supply-chain issues getting access to straw in a suitable form for building. These can be overcome, though.
Data sources:
Yield and area data from UK Gov. DEFRA, 2020, Statistical data set: Structure of the agricultural industry in England and the UK at June - United Kingdom Cereal Yields 1885 Onwards https://www.gov.uk/government/statistical-data-sets/structure-of-the-agricultural-industry-in-england-and-the-uk-at-june
End use and straw yield data from Area of crops grown for bioenergy in England and the UK: 2008-2019 https://www.gov.uk/government/statistics/area-of-crops-grown-for-bioenergy-in-england-and-the-uk-2008-2019