
How insulating is strawbale? Sustainable building materials Part 3 - revised

Originally posted 13th July 2020
NB: I published a version of this blog on 7.5.2020 - I had incorrectly calculated the lambda 90/90 values I reported leading me to incorrect conclusions. This blog is a rewrite with recalculated and thoroughly checked calculations. Some of my conclusions have changed in light of the corrections and a better understanding of the data.
UPDATE, 5/10/2021: These calculations have now been peer reviewed. The resulting discussions have concluded that the calculation is accurate, but particularly highlighted that applying the lambda 90/90 calculation (explained below) to such a wide range of sources will artificially inflate the final value. I’m pleased to say there are now moves afoot to test a large number of UK straw ‘construction grade’ (dense, well-formed bales) in order to obtain a more accurate value for the thermal conductivity of straw as used in UK construction. In the meantime (no pub intended) it may be better to use the mean value which might be closer to reality - either way, I’ll report the actual figures once tests are done and results published.
This blog is a slight tangent but definitely relevant to sustainable building materials. I still intend to write about straw-building in terms of assessing its sustainability (and insulation value is definitely part of that), but for now here’s this: it relates to some of what I’ve been working on lately, as an ‘external expert’ for the School of Natural Building who are a partner in the EU -wide UpStraw project. The UpStraw project aims to promote best-practice in straw building, providing potential builders with reliable information on performance and construction. I’ve written a formal lambda value report for that, but this blog explains the findings in a (hopefully) more conversational way.
Knowing the thermal conductivity of any material you build with is essential. Without it you can’t calculate the energy balance of any building or do any kind of heat flow calculations, from simple U value calculations to complex thermal bridging assessment. The thermal conductivity (or lambda value, represented by the Greek letter λ) quantifies how insulating a material is. It’s the amount of energy that flows through 1 metre thickness of a material, when the temperature difference from one side to the other is 1 degrees Kelvin (a degree Kelvin is equal to a degree Celsius, but the Kelvin scale begins at absolute 0, or -273 degrees Celsius). It doesn’t account for other factors that might affect heat flow, such as varying moisture levels or thermal mass, but is the figure used as the basis of all calculations to assess how insulating and energy efficienct a building is.
Commercial insulation products are held to high standards of consistency and testing – to be used with confidence the same standards should be applied to bio-based insulation materials such as strawbale. The international standard by which the lambda value of insulation materials is measured is ISO 10456. This defines testing and calculation procedures, referencing other standards for the tests themselves.
Various different lambda values have been given for strawbale at different times, from different studies. Some variation is expected given the inherently varied nature of strawbales. But having obsessively read as many academic papers and commercial test reports on the subject as I could get my hands on, I found that the most extreme results at either end of the scale were from tests that didn’t follow reliable repeatable approaches, or that bore very little resemblance to the physical reality of a strawbale wall.
Some tests measured the thermal conductivity of very small samples, assembled by hand with each straw carefully aligned to investigate the effect of straw orientation in relation to heat flow. This has become an important discussion amongst straw builders, as some papers report different thermal conductivities in each direction. The reality inside most bales is that straws are orientated quite randomly, although there may be some bias towards straws being either parallel to the top of the bale or perpendicular to it. ModCell and the University of Bath managed to put a bale through a CT scanner, which showed the straws were randomly orientated (https://twitter.com/ModCellTweet/status/1245126393710743552?s=20).
To come up with what I hope is a reliable lambda value for strawbale I’ve whittled the reported values down to ones that come from tests that comply with ISO 10456 (like all other insulation products have to), and where the test specimens were larger samples assembled from strawbales (rather than very small samples assembled from individual straws). There are some issues with assessing a range of results from different sources in this manner, but I’ll come to that in a bit.
A frustration while compiling this data is that commercial test reports do not have to describe the full test procedure, so the type of straw specimen tested (and how closely it resembles the reality of the strawbale wall) cannot be assessed. Such reports are often taken as the last word in terms of evidence, whereas academic research following the same ISO standards are sometimes ignored - despite the latter having to report all procedures in full in order to enable duplication. The opacity of official test reports bothers me. Nonetheless, I have included data from some such reports (labelled DIBt and SPSC on the following tables) precisely because they represent the source of lambda values adopted by organisations such as the Passivhaus Institute. The standard applied to those tests (EN 12667) suggests a larger test specimen, but no details are given of thickness or how it is assembled.
The results
If you just want to see headline figures then skip down to the tables below. To understand the results properly I need to explain a bit about the statistical process used. This was quite a learning curve for me, but hopefully if I can explain it in terms I understand then it might also make sense to others without a background in statistics!
ISO 10456 sets out the means to establish lambda (λ) 90/90 values for insulation: a thermal conductivity value that 90% of tests will achieve with a 90 % statistical certainty. The smaller the number of samples a calculation is based on, the lower the possible confidence in the certainty of results. The calculation adjusts results to account for this statistical uncertainty. Actual performance may be better than the calculated 90/90 value in some cases, but it should only be worse in 10% of cases – reducing the risk of underestimating heat-flow during building design. The λ 90/90 figures established are approximately equivalent to design values at 23 °C and 50% RH, with results either from samples tested at these conditions or adjusted to reflect them.
This adjustment for uncertainty is achieved through several stages:
Firstly through calculation of the sample standard deviation of results - basically, an average value for how far each test result deviates from the overall mean (average) lambda result. The greater the inconsistencies in results, or the greater the range between them, the greater the standard deviation. For the results below, the standard deviation is quite high as the results come from a variety of sources - the distribution of results across the samples is not quite standard.
Secondly, a number representing a coefficient for a 90 % statistical confidence interval is selected from a table in ISO 10456 (these are fixed numbers, determined by the number of samples being assessed - the same numbers are available in various statistical publications, calculated by people with a much greater understanding of such things than me…). This number (called k2) is smaller for higher numbers of samples (test results) and bigger for a lower number of samples.
Finally, the standard deviation is multiplied by the k2 figure, and added to the mean lambda value for each set of results. So the lambda 90/90 value will be inflated by the calculation for results with greater inconsistencies and lower sample sizes - this accounts for the uncertainty inherent in such results and ensures that 90% of any future samples of the tested material are 90% likely to perform equally or better than the 90/90 value.

he table above gives the calculated lambda 90/90 values for strawbale at 23 °C and 50% RH, based on all results of larger samples complaint with the international standard (ISO 10456). When results for different orientations of straw are separated, the sample size decreases. The 90/90 value in these cases is therefore significantly higher than the mean values, to account for the unreliability of smaller sample sizes. Given the uncertainty about straw orientation in reality and the higher sample size involved, I think it makes most sense to use the value derived from all results - 0.08 Wm/K.
The mean value for all orientations/results together is 0.065 W/mK. The lambda 90/90 value is pushed up as a result of a relatively high sample standard deviation, a result of compiling results from different tests. If all the results were of the same straw, tested in the same test centre under the same conditions, it is likely that the standard deviation and so the 90/90 value would be lower. This might suggest that it doesn’t actually make sense to amalgamate the results of different tests in the way I have done - alternatively it may make the 0.08 W/mK value more robust, as in reality straw is sourced from different places and does vary slightly in each build.
There is an argument for establishing what type of baler produces bales most-frequently used in UK construction (UpStraw is gathering information from strawbale builders and suppliers which includes information on baling machines), and having a minimum of 10 samples (as required by ISO 10456) formally tested at a commercial test centre and a certified lambda 90/90 value calculated. Such a value may be a better representation of thermal conductivity of strawbale in practice in the UK.
How does this compare to other insulation products?
It’s often said by exponents of strawbale building that straw is a good insulator. While building with straw does result in well insulated buildings, it’s a simplification to say it’s a good insulator. Looking at lambda values alone, straw doesn’t perform as well as other bio-based insulation products such as woodfibre boards, cellulose fibre, sheepswool, or cork board - all of which have lambda values in the region of 0.04 W/mK (lower values mean less heatflow/more-insulating-effect).
In practice this means that the same U value can be achieved with a thinner layer of these other materials. The difference is they would often be used in conjunction with a different (less insulating) structural layer. Strawbale mostly comprises the entire thickness of the wall, whereby it can achieve the same U value, and the same overall level of insulation. In other words it would be less insulating compared to a woodfibre layer of the same thickness, but it is rare for woodfibre to be used at the same thickness (even where the full depth of the wall is the same).
The U value for a standard strawbale wall calculated with a lambda value of 0.08W/mK, with a 30mm layer of lime plaster on both sides of a 450mm layer of straw is 0.171 W/m²K (0.171 Watts of heat energy is transferred through 1 square metre of wall, per degree Kelvin difference from internal to external temperature). Current UK building regulation ‘model design’ is based on a U value of 0.18 W/m²K (though the regs urgently need tightening). Passivhaus U values are typically 0.10 to 0.15 W/m²K.
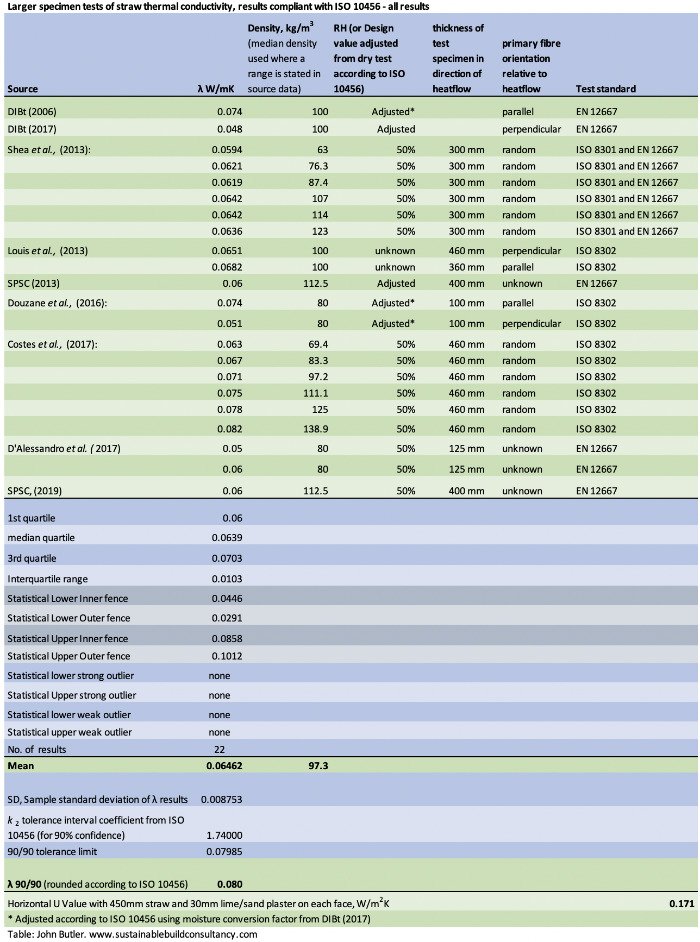
The table above shows all results from the literature for tests of larger samples to ISO 10456. The test standards listed refer to the precise method of measurement and test procedure used - these all come under the umbrella of ISO 10456.
The calculation of quartiles and statistical fences is a simple means to identify statistical outliers - results that lie outside the expected range of results. None are found. The bottom section of the table demonstrates how the calculation of the lambda 90/90 value leads to its increase above the mean result. Additionally, when the calculated 90/90 value is 0.08 W/mK or above the given value must be rounded to the nearest higher 0.005 (below 0.08 it is rounded to the nearest higher 0.001). The same applies to the tables below, which give results first for tests with straw orientation random or parallel to direction of heat flow, then for tests with straw perpendicular to heat flow.

